Correlation Analysis
The next step in our data analyses is to explore the correlations among price as well as the main seven features of our dataset: longitude, latitude, living area, bedrooms, bathrooms, zipcode, and city. I'll also throw the Zestimate in there just for fun. For our purposes, the correlation metric we're going to use to gauge correlation is the Spearman correlation coefficient. The reason we're using Spearman and not Pearson is because the Pearson coefficient makes certain assumptions about the data, like it being normally distributed and having linear relationships, while the Spearman correlation doesn't.
Single Family Homes
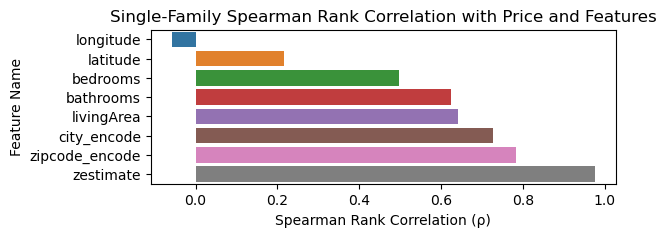
This first plot represents the Spearman correlation coefficient between price and the primary seven features and the zestimate. In this plot, we see some interesting trends - the price of single family homes depends the most on zip code, and it is also nice to see that the Zestimate is almost completely correlated with the price. However, a strange pattern I wasn't expecting is how the price of single family homes depends much more on the number of bathrooms rather than the number of bedrooms, which is the opposite of what I thought would be the case.
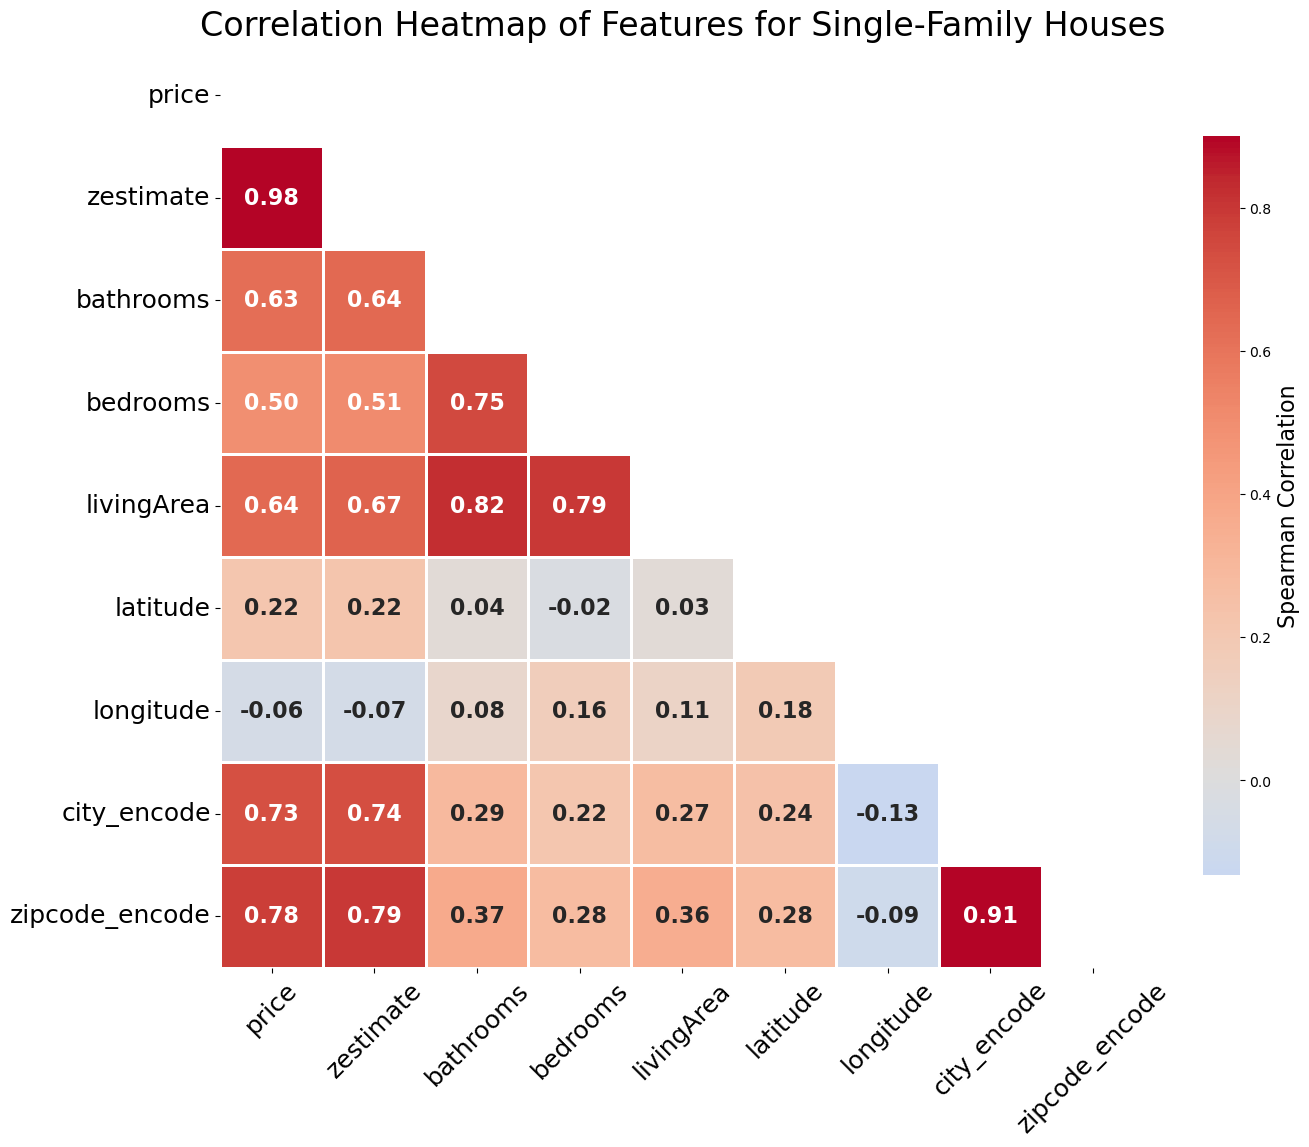
To me, the most interesting part of this heatmap is just how highly correlated the living area, bedrooms, and bathrooms are, and this makes a lot of sense when we take into account the graphs we saw on the previous page. As a good sign, we also see a very high correlation between the zip code and the city, which makes sense because cities are usually associated with specific zip codes.
Manufactured Homes
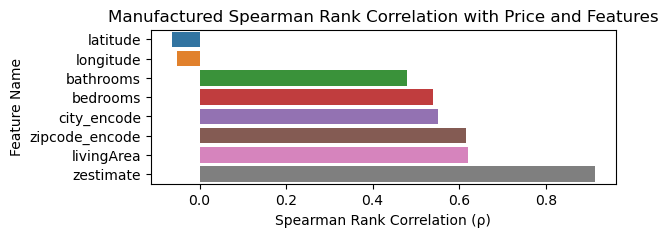
In contrast to the single family plot, many of the highest correlating features for single family homes, namely zip code and living area, are not as highly correlated as they were with the single family homes. Furthermore, we also see that the Zestimate is slightly less correlated with the price, and zip code is no longer the highest correlating featuer. Instead, living area is just barely more correlated with price than zip code. Furthermore, the biggest change is with longitude, which is now negatively correlated with price.
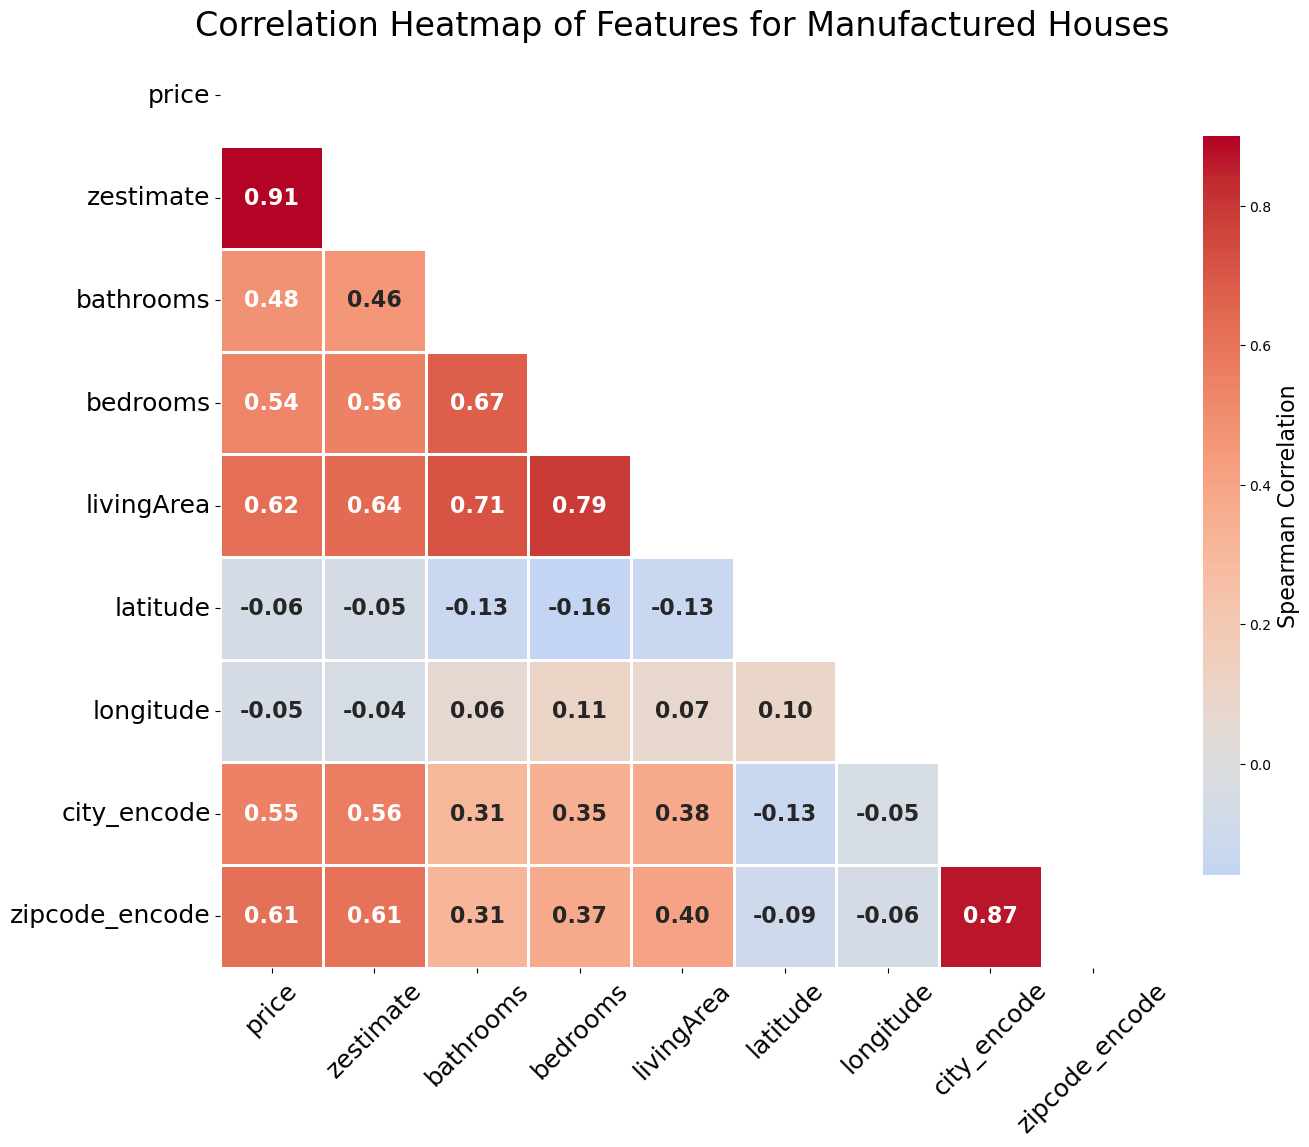
Looking at this heatmap, the biggest change from single family homes is how living area and bedrooms are less correlated with bathrooms than they were with single family homes despite the correlation between living area and bedrooms being the same. I always thought that manufactured homes were pre-planned and made en masse, so I would have been inclined to believe that the number of all home features would be more correlated with each other.
Final Note
Correlation analysis is a super useful tool for understanding the relationships between features in a dataset, and I think that the most interesting part of this page was how bathrooms have a bigger correlation with price than bedrooms do for single family homes - who woulda thought! I also think that the differences between the single family and manufactured homes are very interesting, especially how the Zestimate seems less correlated with the price of manufactured homes than it does with single family homes. This could indicate how the Zestimate is slighlty less accurate for manufactured homes than it is for single family homes.
Next Page: Geography