Data Cleaning Process
Cleaning data is an essential process in any data science project. It ensures data quality and improves the reliability of my analysis. Here's a look at how I cleaned my dataset for Yillow.
First and foremost, I made sure there were no duplicate entries in our dataset. Duplicate records can skew the analysis and provide inaccurate results, but thankfully there were actually 0 duplicates!
Next, I dealt with missing values in the secondary features. Wherever data was missing, I assigned a 'NoValue' tag. This would ensure that, during the feature engineering process, features with missing values would get their own category/assignment. By doing this, I retained the record while acknowledging the absence of certain information.
Lastly, I ensured data consistency. It's vital that the same type of data is represented consistently across the dataset. For example, if living area is represented in square feet, I made sure it's not accidentally entered as square meters in some instances.
Outlier Detection and Removal
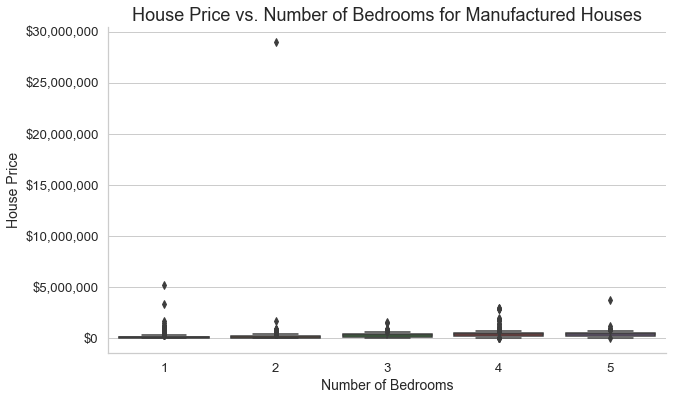
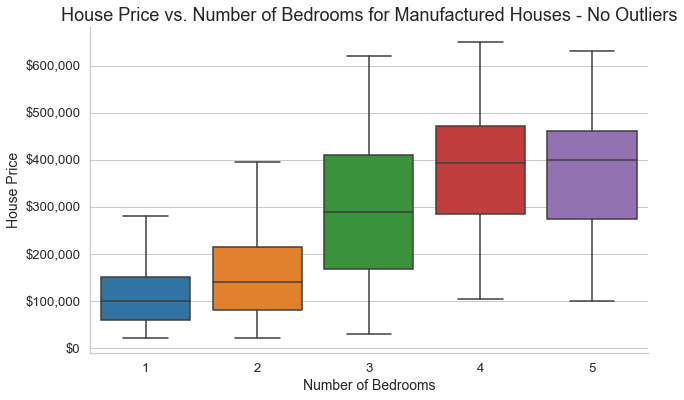
Outliers can be killers when it comes to predictive models because they can really skew predictions. The real Zestimate has to take into account outliers, but because of the small dataset of Yillow and also because the Yestimate is supposed to be a predictive model to help people (me, in particular) buy a house, I am going to assume that I'm not very interested in houses that are super overpriced. Because of this, I decided to remove outliers from the dataset. To do this, I used box-and-whisker plots to identify outliers and then removed them. Although this makes the Yestimate less effective on outliers, it makes it more effective on the majority of houses.
Summary
With these steps, I made sure my data was clean and ready for feature engineering. This process enhances the reliability of my subsequent findings and ensures the Yestimate is built upon a solid foundation of quality data. However, in doing so, I also make the Yestimate work much less effectively on those outliers I removed. As I'm going through the data science process, I keep making the data represent a smaller and smaller subset of all houses, such as limiting the dataset to houses in Washington, only. However, I think that this is justified because a model that works well on a small subset of data is better than a model that doesn't work well on any of the data.
Next Page: Feature EngineeringYillow was created by Brandon Bonifacio with the help of a variety of sources which are credited on our References page.
Come check out my personal website or connect with me on LinkedIn!
Disclaimer: Yillow is an independent project, not affiliated with or endorsed by Zillow in any way. It is created for educational purposes and is not intended to infringe on any rights of Zillow.
No rights reserved - whatsoever.